

<!DOCTYPE html>
<html lang="en">

<head>
    <meta charset="UTF-8">
    <meta name="viewport" content="width=device-width, initial-scale=1.0">
    <title>Audio Visualization with Canvas</title>
    <style>
        body {
            display: flex;
            justify-content: center;
            align-items: center;
            height: 100vh;
            background-color: #000;
        }

        canvas,
        audio {
            display: block;
            margin: 0 auto;
        }
    </style>
</head>

<body>
    <div>
        <canvas></canvas>
        <audio src="./华晨宇 - 烟火里的尘埃.mp3" controls></audio>
    </div>

</body>

</html>
<script>
const audio = document.querySelector('audio');
const canvas = document.querySelector('canvas');
const ctx = canvas.getContext('2d');
canvas.width = window.innerWidth * 0.8; // 响应式宽度
canvas.height = 100; // 更高的画布以提供更好的视觉效果
const audioContext = new (window.AudioContext || window.webkitAudioContext)();
let audioBuffer;
let isDragging = false;
// 异步加载并解码音频文件
fetch('./华晨宇 - 烟火里的尘埃.mp3')
.then(response => response.arrayBuffer())
.then(arrayBuffer => audioContext.decodeAudioData(arrayBuffer))
.then(decodedData => {
audioBuffer = decodedData;
drawWaveform('grey'); // 首次绘制波形
})
.catch(error => console.error("Error loading or decoding audio:", error));
function drawWaveform(color) {
// 获取音频总时长
const duration = audioBuffer.duration;
// 获取音频的第一个通道的数据。如果是立体声音频,也可以获取第二个通道的数据
const channelData = audioBuffer.getChannelData(0);
// 获取画布的宽度,用于确定绘制波形的范围
const width = canvas.width;
// 获取画布的高度,用于计算波形的振幅
const height = canvas.height;
// 计算步长,即每个波形样本对应的原始音频数据的数量。这是为了确保波形图适应画布的宽度
const step = Math.ceil(channelData.length / width);
// 计算振幅,即波形图中最大振幅对应的像素值。这里将画布高度的一半作为最大振幅
const amp = height / 2;
// 清除画布,准备绘制新的波形图
ctx.clearRect(0, 0, width, height);
// 遍历画布的宽度,每次增加3个像素(为了提高性能和减少绘制的密度)
for (let i = 0; i < width; i += 3) {
// 初始化最小值和最大值,用于找到当前步长中的最大振幅和最小振幅
let min = 1.0, max = -1.0;
// 遍历当前步长中的所有样本
for (let j = 0; j < step; j++) {
// 获取当前样本的值
const datum = channelData[i * step + j];
// 更新最小值和最大值
if (datum < min) min = datum;
if (datum > max) max = datum;
}
// 计算当前波形的最低点和最高点的Y坐标
const yLow = (1 + min) * amp, yHigh = (1 + max) * amp;
// 设置绘制颜色。如果当前位置小于音频的当前播放时间比例,则使用'blue',否则使用传入的颜色
ctx.fillStyle = i / width < audio.currentTime / duration ? 'blue' : color;
// 绘制一个矩形来表示当前的波形样本
ctx.fillRect(i, yLow, 2, yHigh - yLow); // 使用2像素的宽度来提高波形的可见性
}
}
// 监听音频播放进度更新,重绘波形图
audio.ontimeupdate = () => drawWaveform('grey');
// 设置音频时间
function setAudioTime(x) {
const duration = audio.duration;
audio.currentTime = (x / canvas.width) * duration;
}
// 添加事件监听器以支持点击和拖动操作
canvas.addEventListener('mousedown', e => {
isDragging = true;
setAudioTime(e.offsetX);
});
window.addEventListener('mouseup', () => {
isDragging = false;
});
canvas.addEventListener('mousemove', e => {
if (isDragging) {
setAudioTime(e.offsetX);
}
});
// 窗口大小改变时调整画布大小
window.addEventListener('resize', () => {
canvas.width = window.innerWidth * 0.8;
drawWaveform('grey');
});
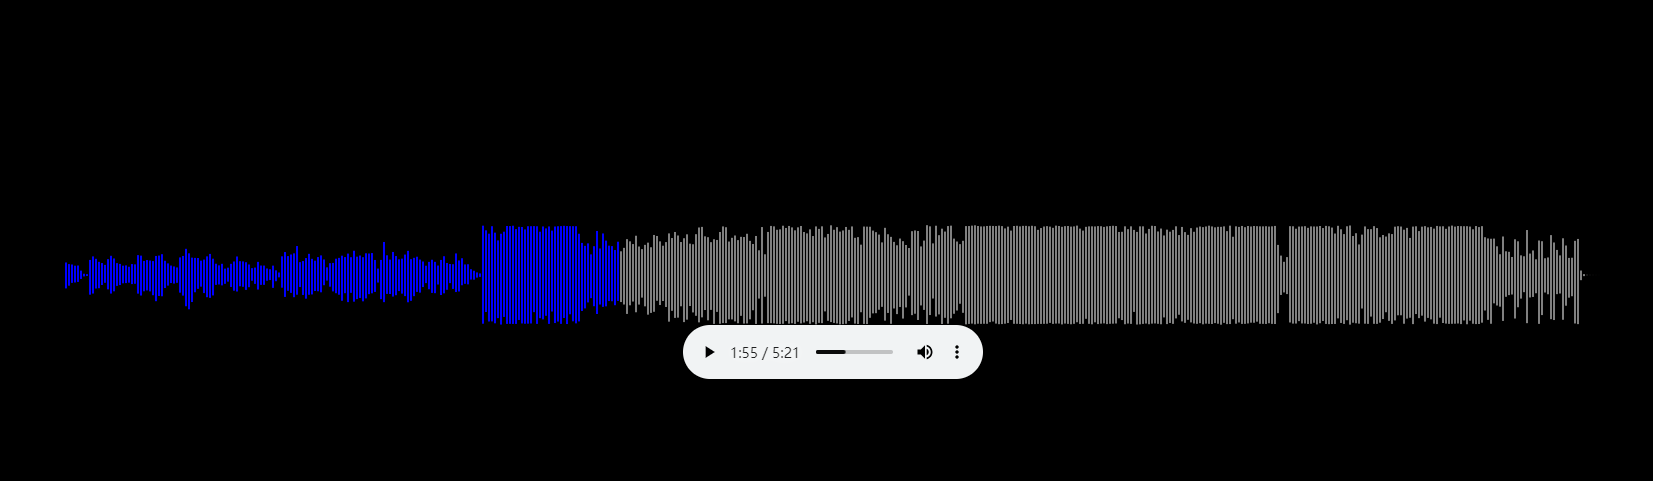
</script>效果图

请登录后查看回复内容